Classic Funnel
What is it
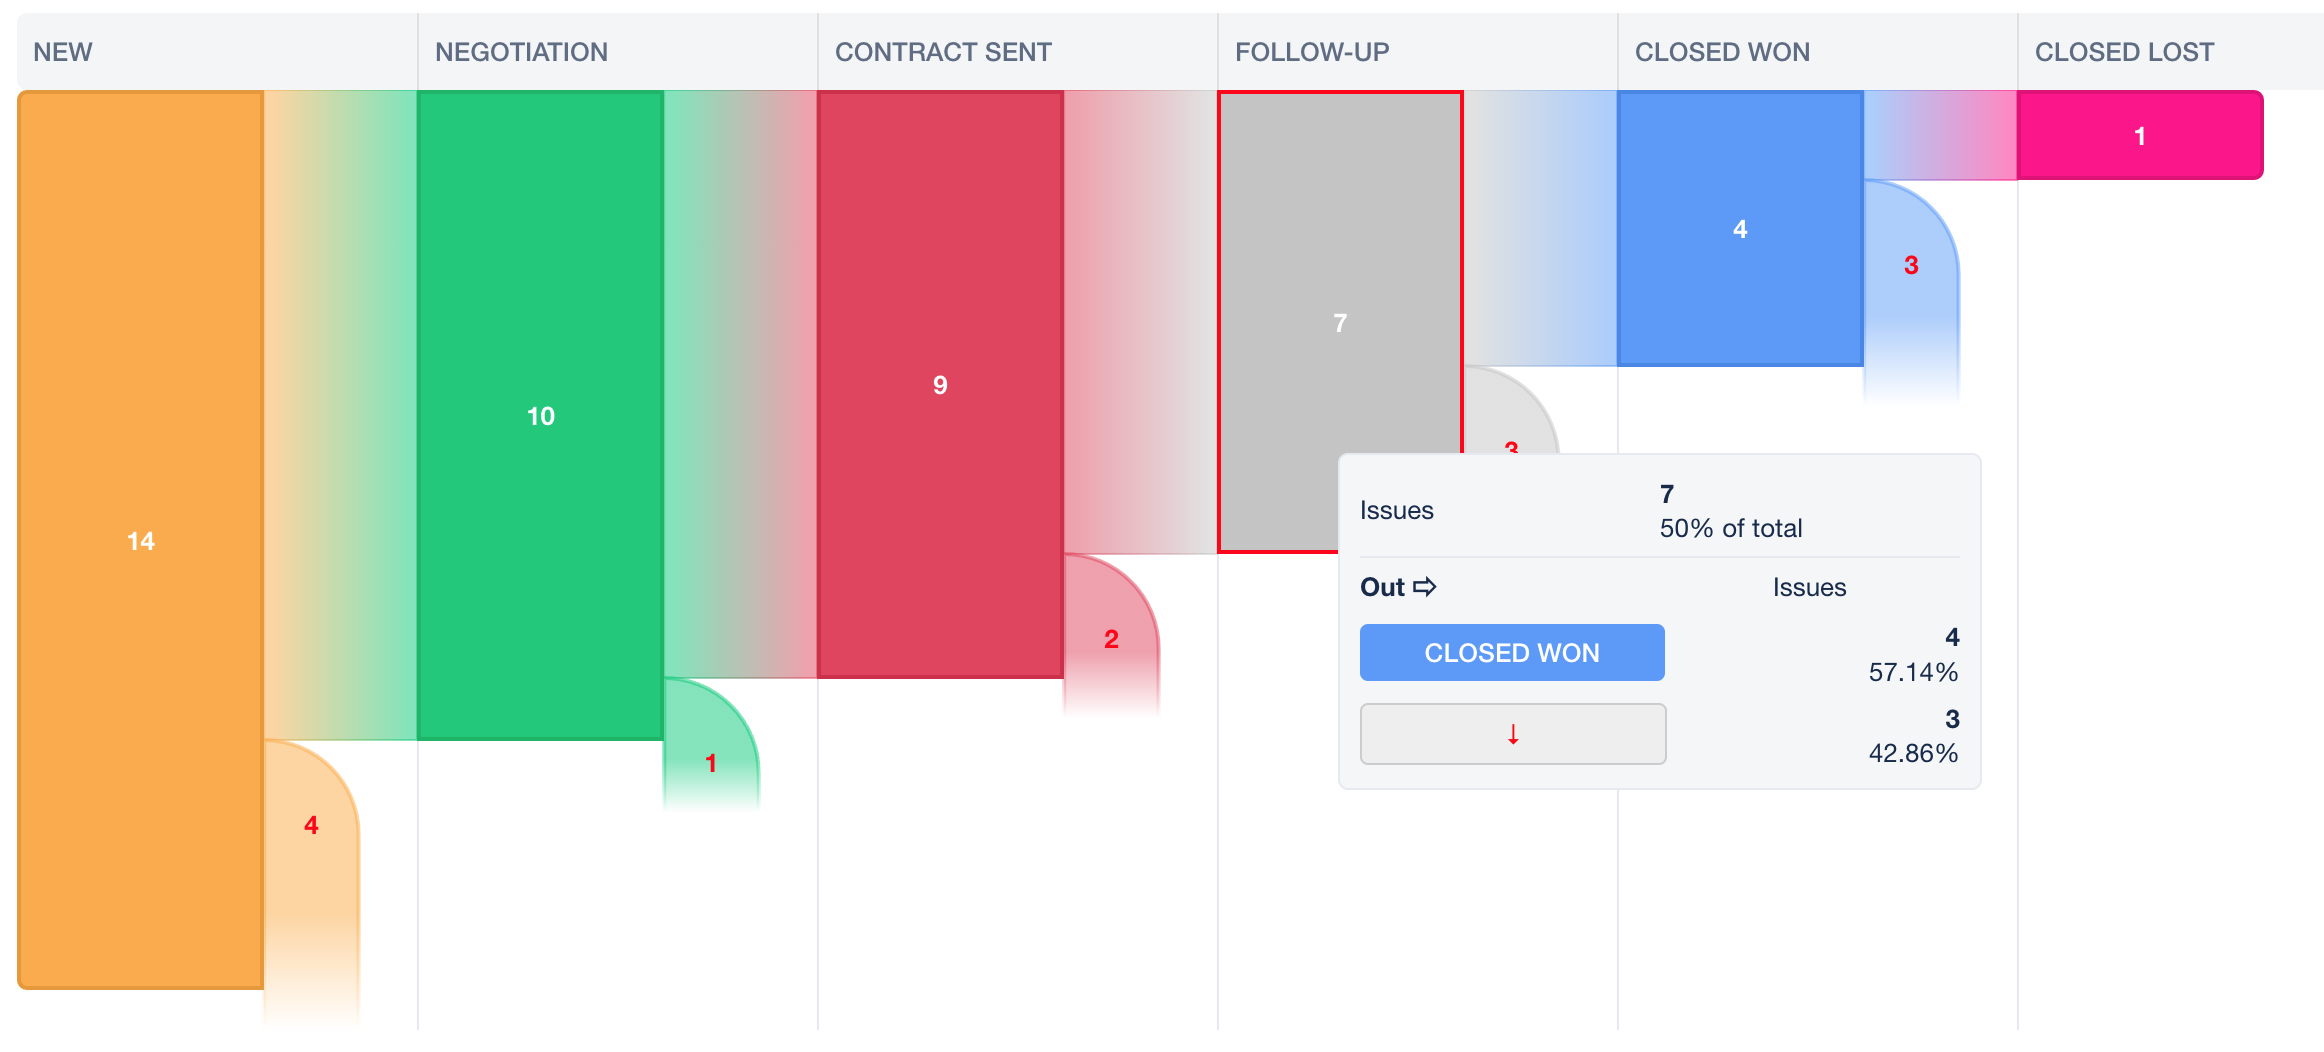
Section titled “What is it”This view lets you visualise traditional funnel showing number of issues per column (by default a column contains single Status, but you can configure it to contain more, as well as change the order of columns).
This chart can be used to show any workflow, but is typically used to show sales or marketing funnels.
Chart assumes, that reaching certain column means an issue went through all previous columns. For example:
- given 3 columns: Todo -> Doing -> Done
- and 3 issues:
- 1 issue in Todo column
- 1 issue moved Todo -> Done
- 1 issue moved Todo -> Doing
- chart will show:
- 3 issues in Todo column
- 2 issues in Doing column (this includes issue which moved to Done)
- 1 issue in Done column
Set up
Section titled “Set up”Select issues for the chart
Section titled “Select issues for the chart”Use JQL editor:
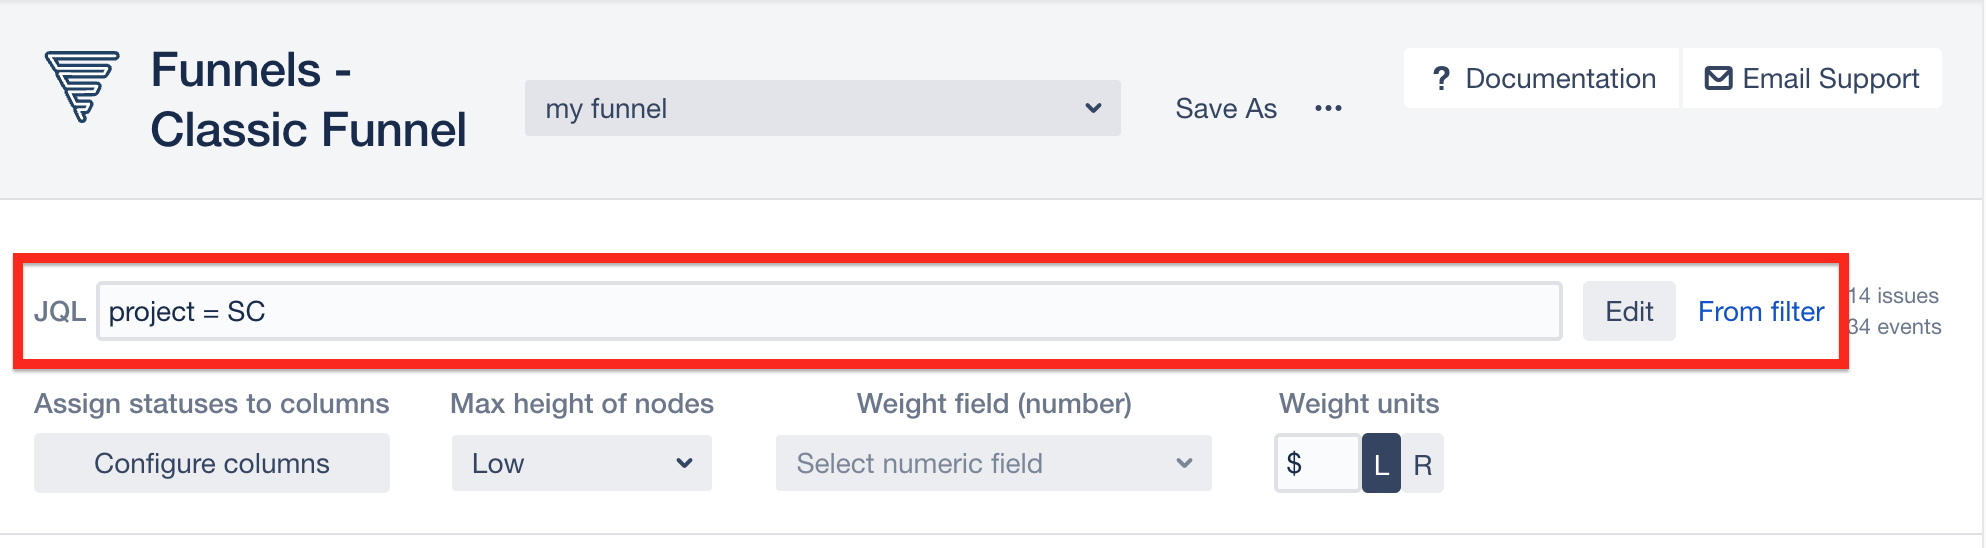
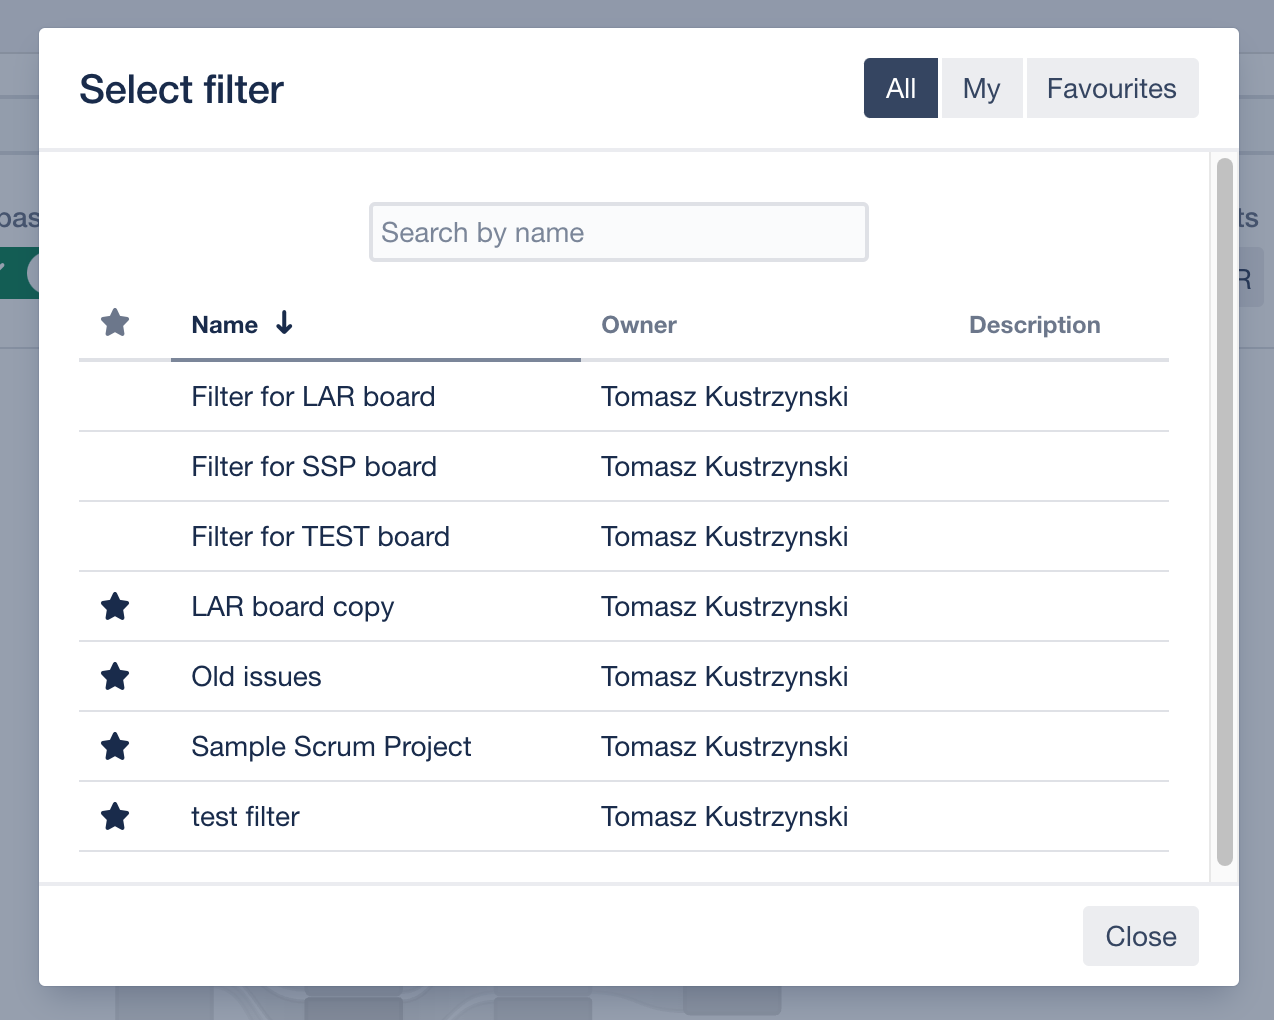
or select from existing filter:
Configure columns
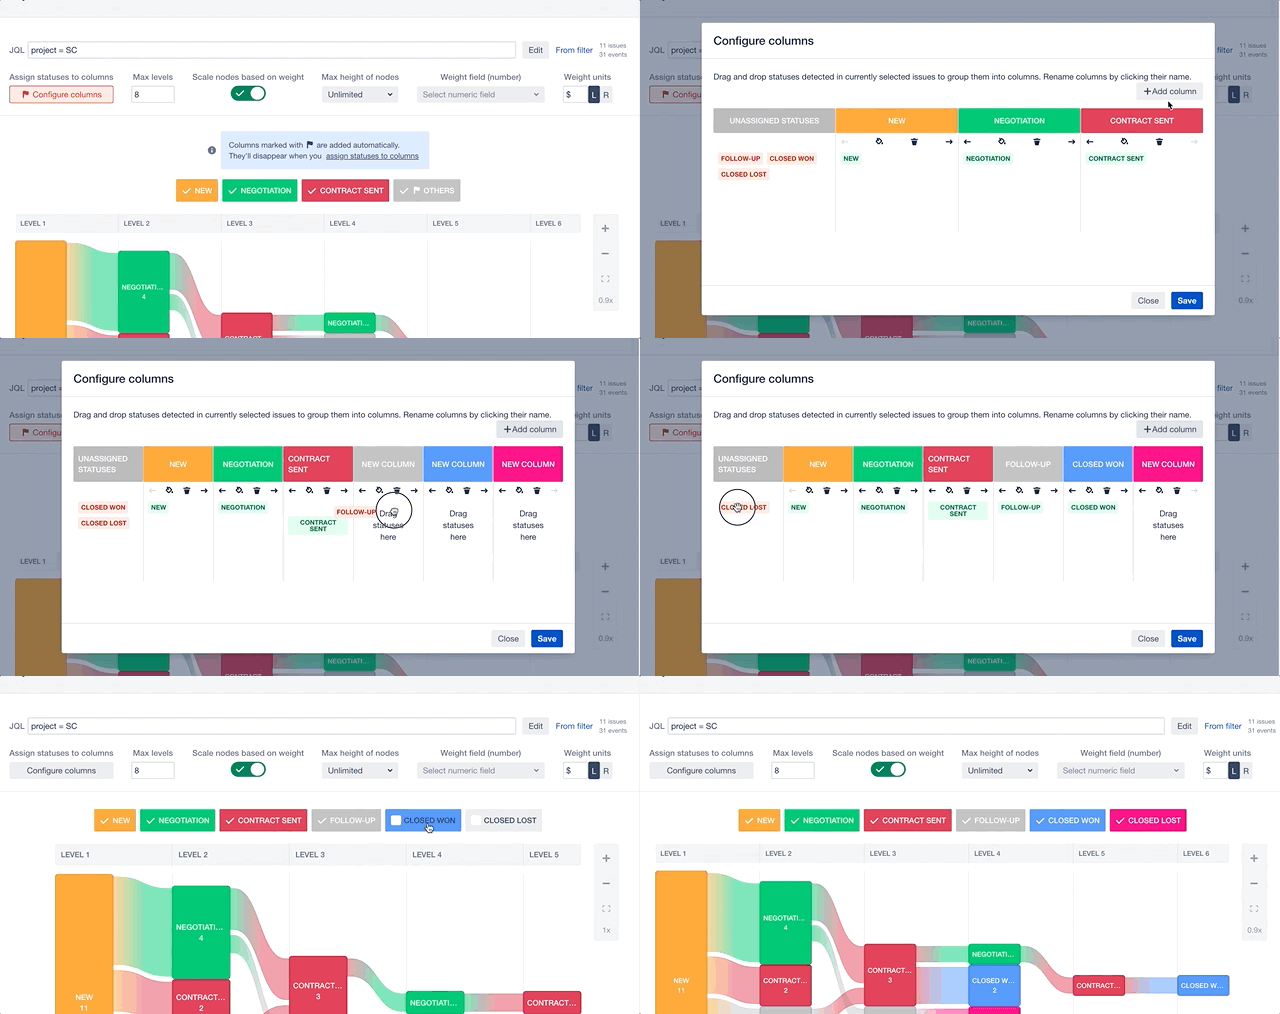
Section titled “Configure columns”By default columns are created from Statuses. There's 1 column per Status. Columns created automatically have a flag icon next to their name.
Manual configuration in Configure Columns modal allows for more flexibility:
- change of order / name / colour of columns
- assigning more than 1 Status to a single column
Select columns
Section titled “Select columns”By default no columns are selected for display. Select any number of columns to create chart off them.

Use weights
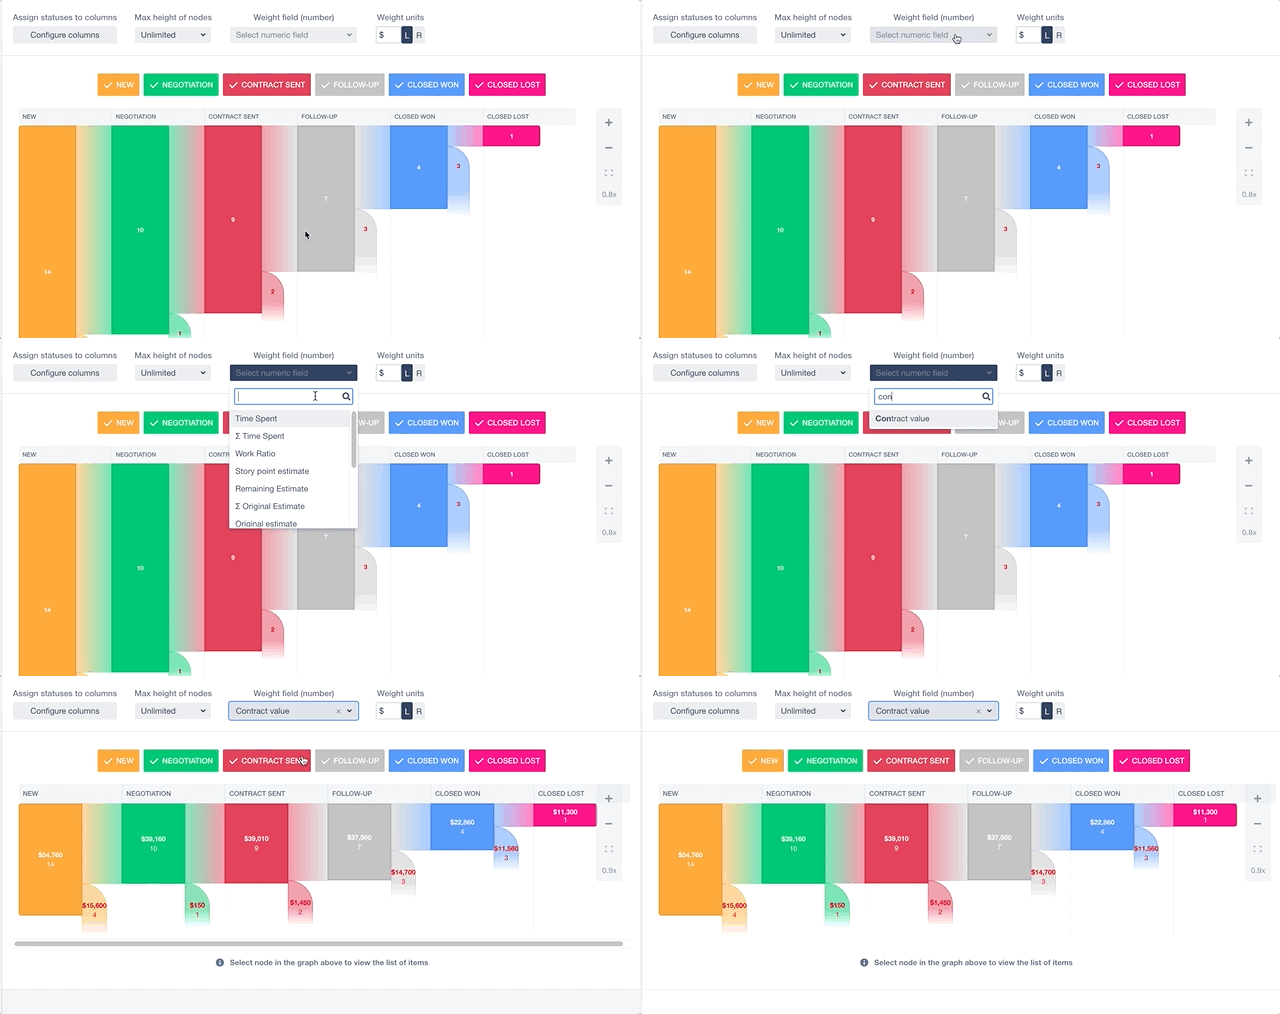
Section titled “Use weights”By default chart uses number of issues to show the size of nodes (the weight of each issue is 1). You can override it with any numerical field. When a weight field is selected, you can also specify a unit to be displayed before or after weight value.
Adjust height of nodes
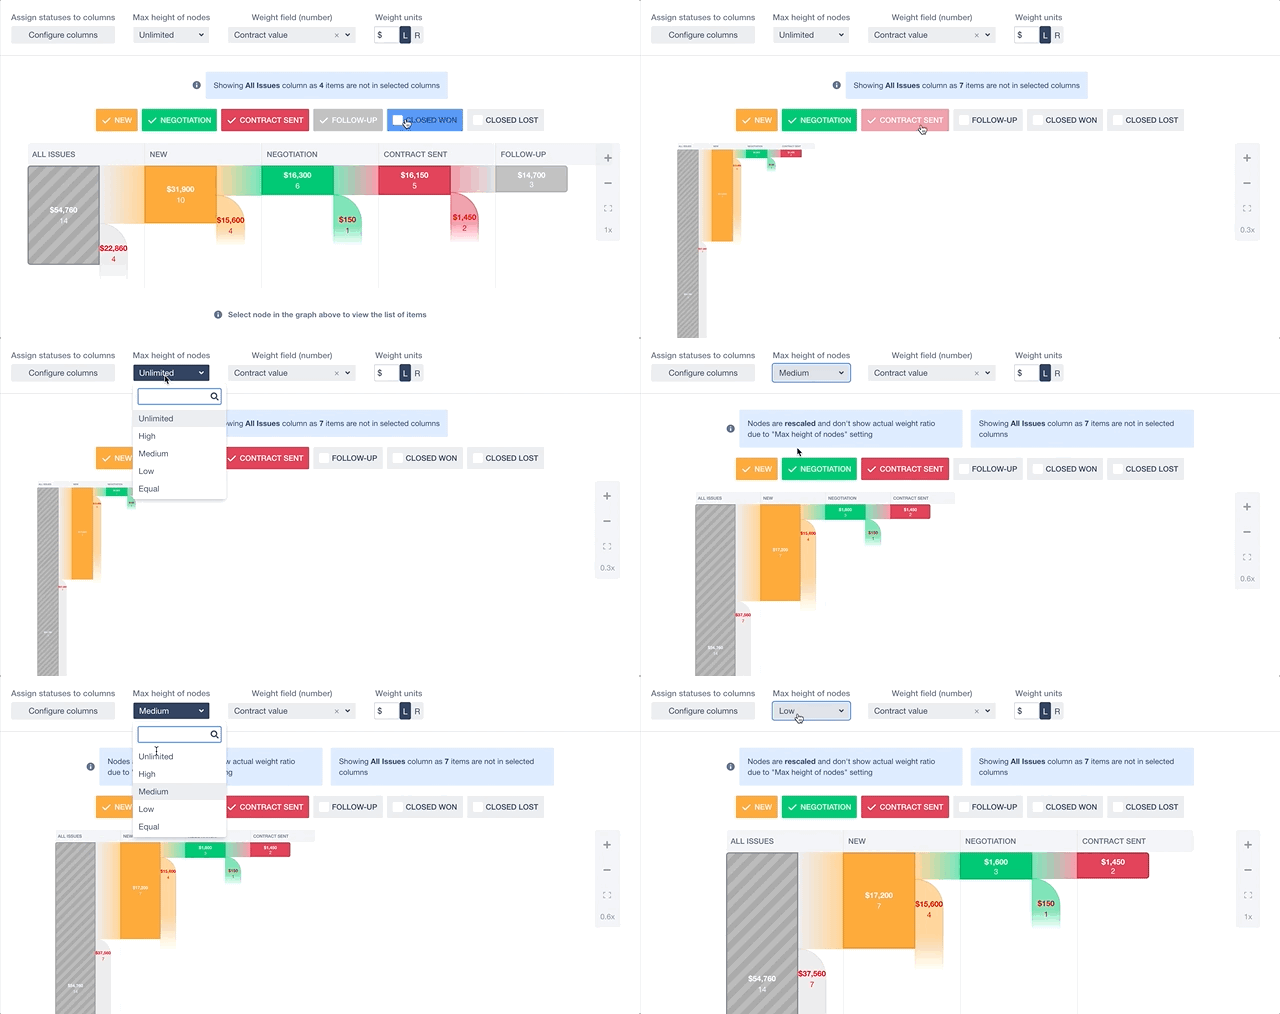
Section titled “Adjust height of nodes”In some cases, when weights of nodes differ a lot, chart becomes difficult to read. To prevent the effect of very large nodes next to very small ones, you can use Max height of nodes option to balance the height of nodes.
Reading the chart
Section titled “Reading the chart”Hover to view details of nodes
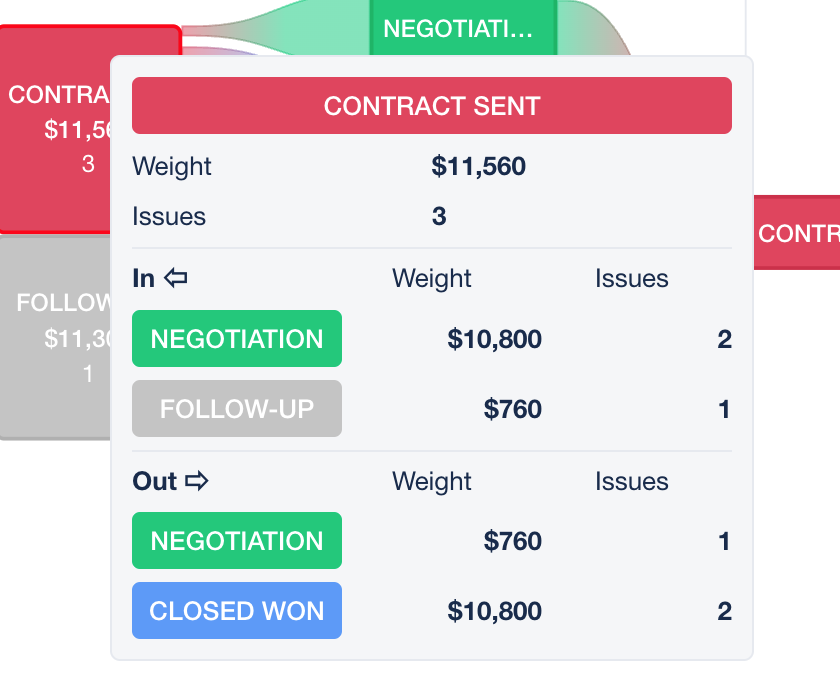
Section titled “Hover to view details of nodes”Hovering over any node gives more details on number and weight of issues which went in and out of the column.
Click any node to see the list of issues in it
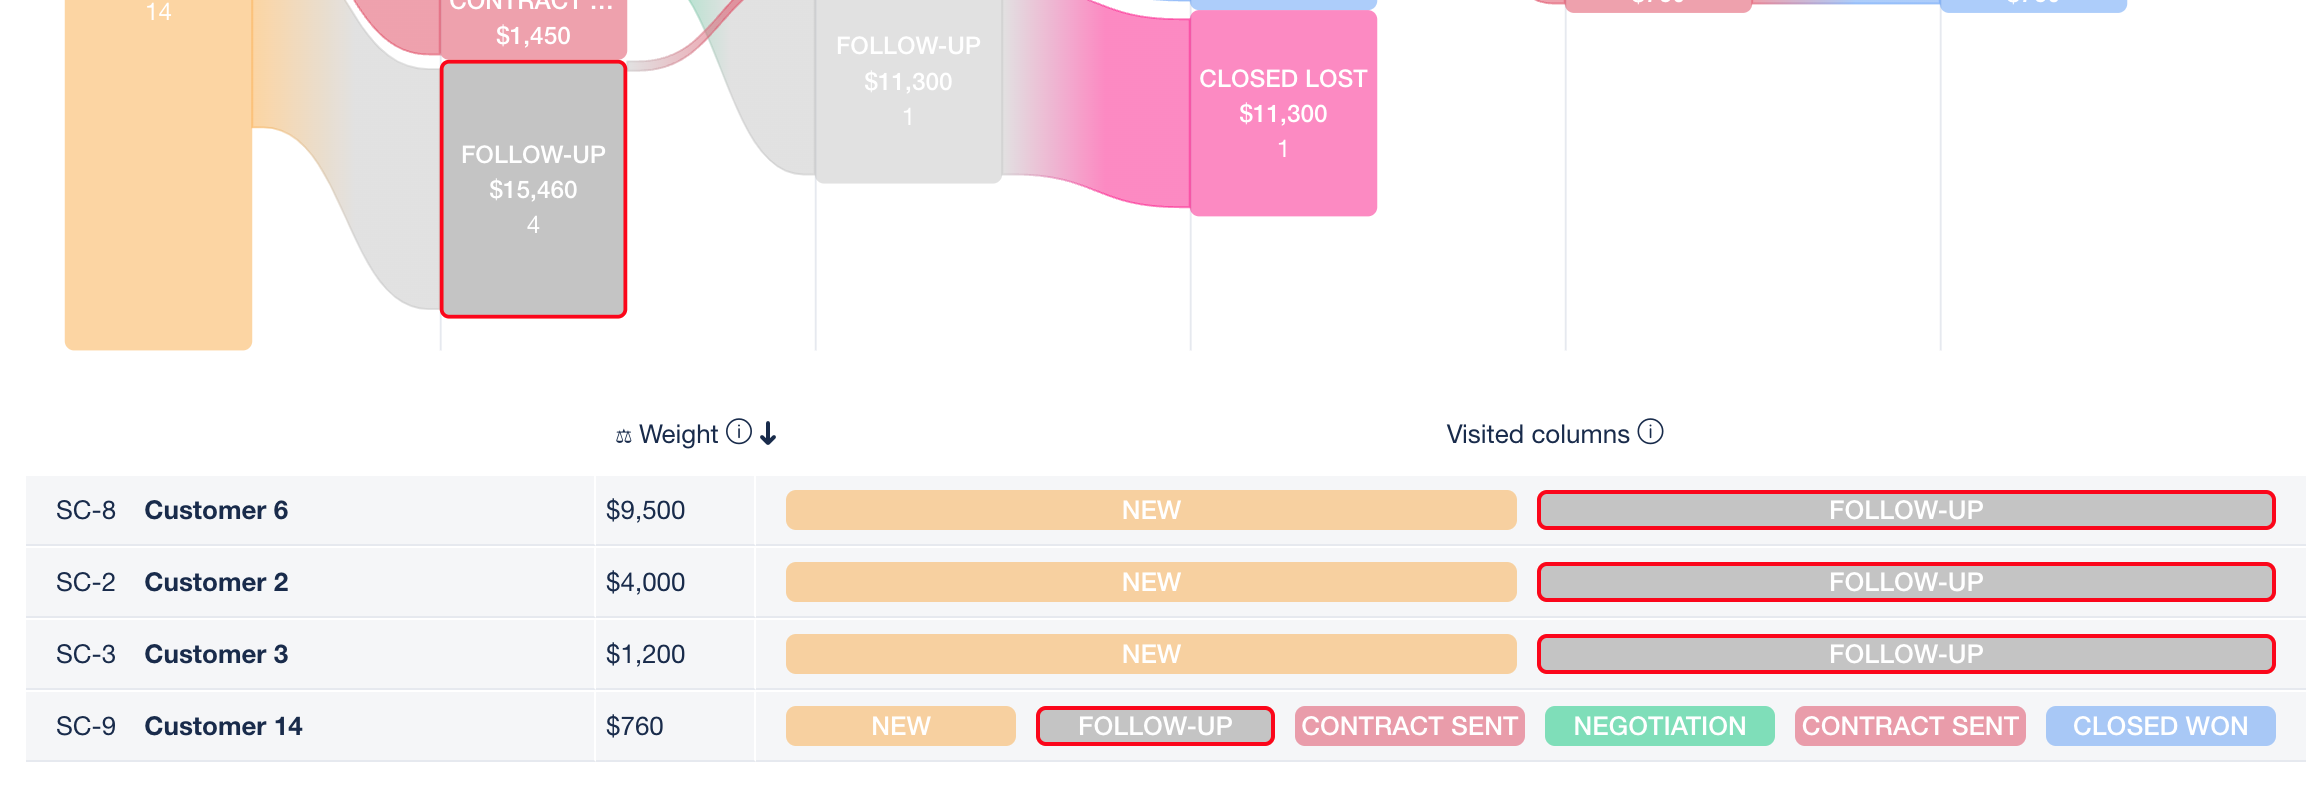
Section titled “Click any node to see the list of issues in it”Selecting a node shows issues in it, together with a list of visited columns and weight values per issue.
Saving chart configurations
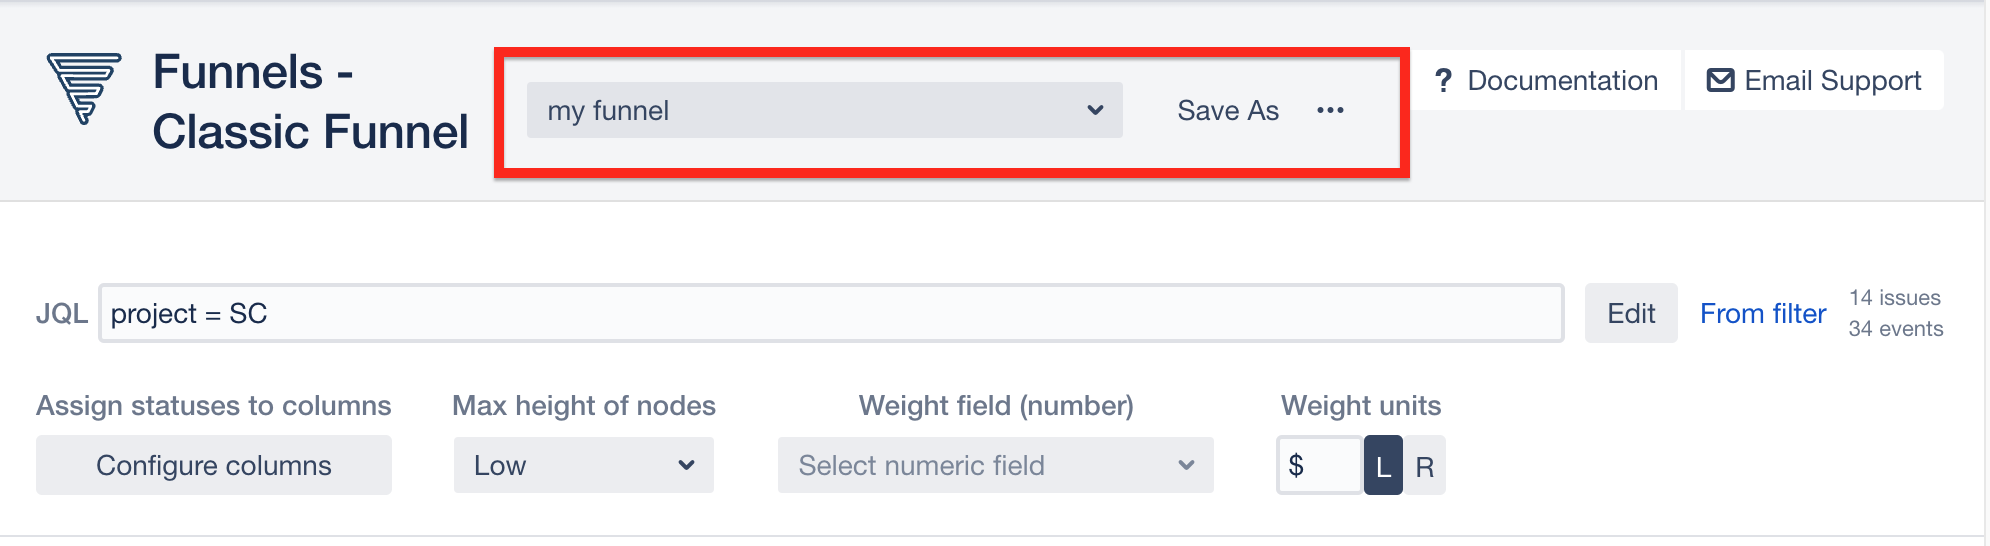
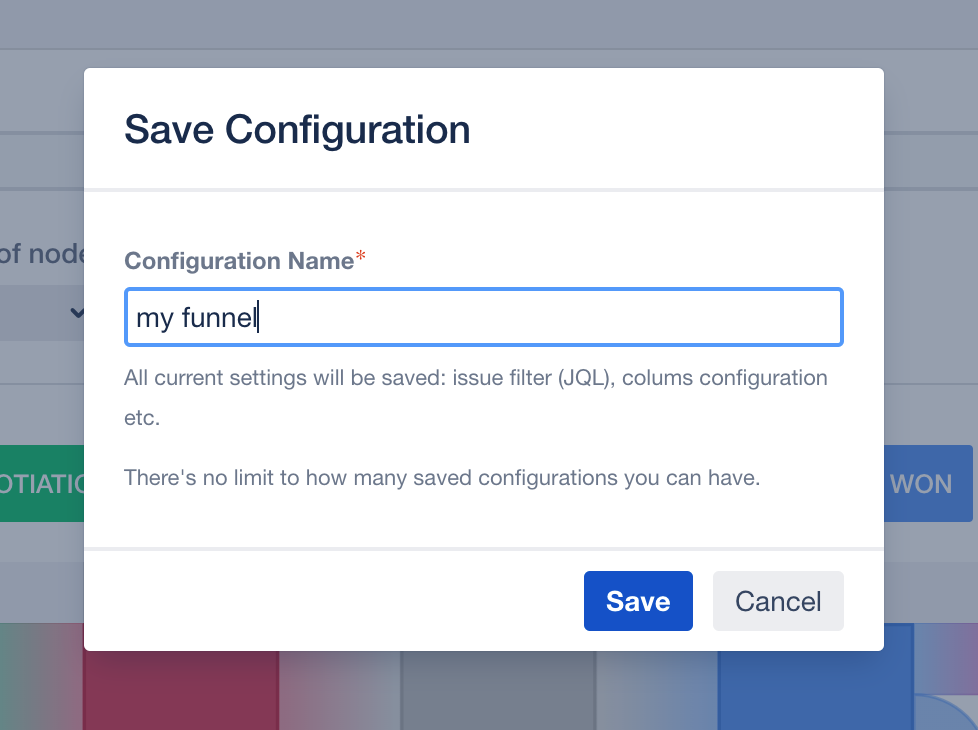
Section titled “Saving chart configurations”Configuration of the chart can be saved and reused. Saved configuration preserves all the settings, including JQL, column configuration and all the other options.